

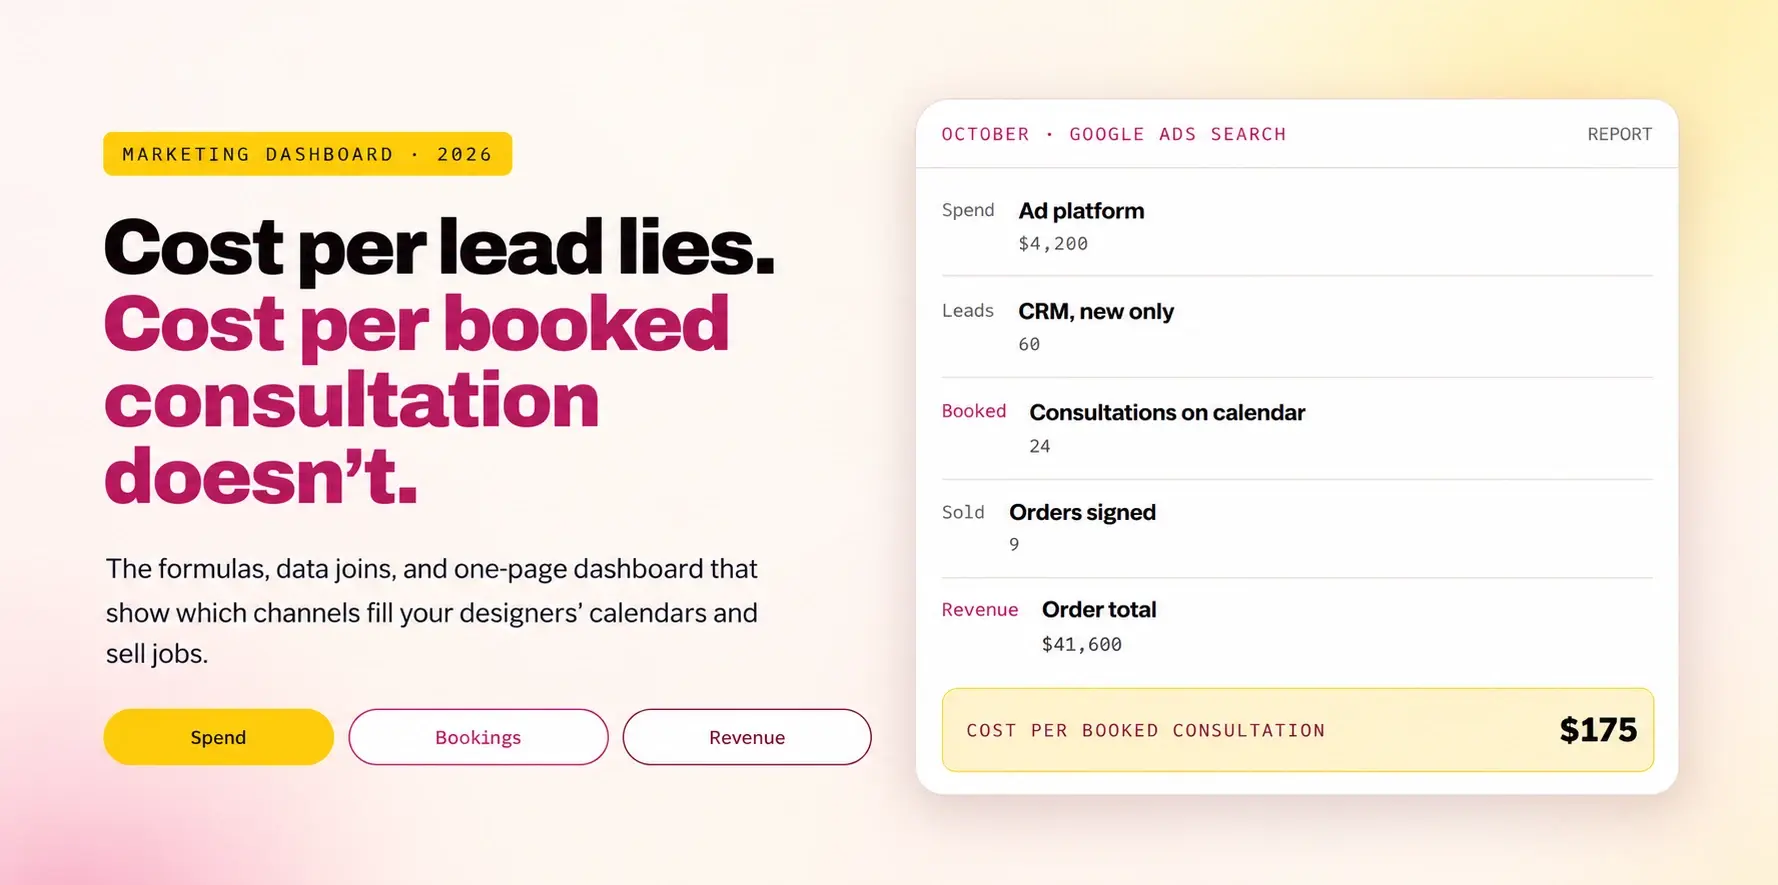
Two channels each cost $3,000 last month. One produced 80 leads, the other 35. On a cost-per-lead report, the first wins easily. Then you look at the calendar: the 35 leads booked 20 consultations, and the 80 booked 14.
Cost per lead measures how cheaply you can get people to raise their hand. Cost per booked consultation measures how cheaply you can get a designer into a home with a real buyer. For a window treatment business, the second number is the one that predicts revenue.
This guide gives you the formulas, the data you need from ads and the CRM, how to join them, a dashboard layout, benchmarks to set for yourself, and how to act on what you find. All example figures are illustrative.
What Is Cost per Booked Consultation?
Cost per booked consultation is the total cost of a marketing channel in a period divided by the number of in-home consultations booked from that channel in the same period.
It sits between two more familiar numbers. Cost per lead is easy to get but says little about quality. Cost per sale is the truest number but arrives slowly, because many window treatment projects close weeks after the first call.
Cost per booked consultation is fast enough to manage month to month and close enough to revenue to trust. It answers the question owners actually care about: how much does it cost to get a designer in front of a real buyer?
Why Is Cost per Lead Misleading for Dealers?
Because lead quality varies widely by channel. A cheap lead that never books is more expensive than a costly lead that buys.
These figures are illustrative, but the pattern is common. Social lead forms, marketplaces, and broad display often produce many leads at a low cost per lead and a lower booking rate. Search, Google Business Profile, and referrals often cost more per lead and book far more often.
Without booked data, budget drifts toward the cheapest leads. Your social ads might still be worth running, but you need the full funnel to know how much to spend and how to qualify.
Which Metrics Belong on the Dashboard?
A full funnel by source: spend, leads, contacted, booked, shown, quoted, sold, and revenue, with the rates and costs between each step.
If contact rate is low, the problem is response, not marketing. If booking rate is low but contact rate is high, look at lead quality and the first conversation. If close rate is low, look at the consultation itself. The funnel tells you where to look.
What Counts as Cost?
Everything you spend to get leads from that channel: ad spend, platform and marketplace fees, agency or management fees, creative, printing and postage, and call tracking or software allocated to it.
Be consistent rather than perfect. If you split a $2,000 agency fee across channels, use the same rule every month. A slightly rough but consistent cost model is much more useful than a precise one that changes each time.
What Data Do You Need, and Where Does It Live?
Spend lives in ad platforms and invoices. Leads, stages, and revenue live in your CRM. Source ties them together.
The weak link is almost always source. If 30% of leads have “unknown” source, every cost metric is wrong. Fix capture first with our call tracking and attribution guide, then build the dashboard.
How Do You Join Ad Spend With CRM Data?
Normalize channel and campaign names, then join spend and CRM counts by month and channel. Start in a spreadsheet; move to a dashboard tool once the logic works.
Decide how to count leads that booked in a later month than they arrived. The simplest rule is cohort reporting: count bookings and sales against the month the lead was created. It is slower to fill in but gives fairer comparisons.
What Should the One-Page Dashboard Show?
Four blocks: a top-line summary, a channel table, a trend chart, and a short notes section with decisions.
Keep it to one page. If the owner cannot read it in five minutes, it will not be used. Detailed campaign-level views can live on a second tab for whoever runs the ads.
How Do You Set Your Own Benchmarks?
Work backward from your margins: the most you can afford to pay for a booked consultation is what a consultation is worth to you, minus the profit you want to keep.
The example uses illustrative numbers. Plug in your own averages from the last six to twelve months. The result is your ceiling. Channels well below it deserve more budget; channels near or above it need fixing or cutting.
Industry averages are rarely useful here, because order values and close rates differ so much between a blinds-only dealer and a shutter and motorization specialist. Your own break-even number is the benchmark that matters.
How Do You Act on the Numbers?
Review monthly, decide quarterly. Shift budget toward channels well below break-even, fix the funnel step that leaks on weaker channels, and test one change at a time.
Avoid reacting to a single month. Window treatment demand is seasonal, and one month can swing on a few large orders. Two to three months of consistent data is a safer basis for moving money.
How Does It Connect to Ad Platform Bidding?
Send booked consultations and sales back to ad platforms so their bidding optimizes for the same number your dashboard tracks.
Your dashboard tells you which channels and campaigns deliver booked consultations. Ad platforms, left alone, optimize for whatever conversion they can see, usually form fills. Offline conversion import sends booked consultations and sales from the CRM back to Google Ads, so bidding and reporting line up.
Once that is in place, cost per booked consultation in Google Ads should roughly match your dashboard. When they differ a lot, it usually means a tracking gap worth investigating. Lead scoring adds another layer: report booked rate by score band to see which sources bring the projects you want. See our lead scoring guide.
How Do You Roll It Out in 30 Days?
Week 1 clean source data, week 2 build the spreadsheet, week 3 calculate break-even and review, week 4 automate and set a monthly review meeting.
The first version will raise questions about data quality. That is useful. Each fix makes the next month’s numbers more trustworthy, and within a quarter you will be making budget decisions on evidence instead of instinct.
Twenty questions about how you measure marketing
Answer yes or no. Every no is a place budget decisions may be based on the wrong number.
Data
5 itemsCosts
5 itemsDashboard
5 itemsDecisions
5 itemsIf several answers are no, budget is following clicks instead of consultations. That's fixable.
Frequently Asked Questions About Cost per Booked Consultation
What is cost per booked consultation?+
Why not just use cost per lead?+
What costs should be included?+
What is a good cost per booked consultation for a blinds company?+
How often should we review the dashboard?+
What tools do we need?+
Spend on What Fills the Calendar.
When every channel is measured by the cost to get a designer in front of a real buyer, budget decisions get simpler. Strong channels grow, weak ones get fixed or cut, and marketing becomes a predictable part of the business.
Track the funnel. Know your break-even. Move budget on evidence.
For related guides, see call tracking and attribution, offline conversion import, and window treatment marketing.
Yay Blitz helps window treatment companies connect Graphic and Web Design, Paid Local Advertising, and AI Lead Management into one measurable system for getting and converting leads.
If you cannot see cost per booked consultation by channel, start with a Free Strategy Assessment. We will review your data and help you build a dashboard that shows which marketing pays.
 Funnel Strategy
 Graphic & Web Design
 Paid Local Ad
 Social Media Marketing